Using Notion to set things in motion
Table of contents
- Task breakdown
- Choosing tool for project and task planning
-
Steps to set up a Scrum-based project management system in Notion
- Part 1: Core Database Setup
- Part 2: Create Essential Views
- Part 3: Create Project Dashboard Template
- Set 2: Add Linked Database - Projects
- Step 3: Add Linked Database - Epics
- Step 4: Add Linked Database - Stories
- Step 5: Add Linked Database - Current Sprint Tasks
- Step 6: Add Linked Database - Backlog
- Part 4: Create Your First Project
- Part 5: Sprint Planning and Execution
Ultimately, I decided I want to manage my hobby projects in a Scrum style.
I can see people screaming: “Are you insane? What drugs are you on? Why do you want to turn your fun activity into something that feels like some annoying and life-draining corporate project?” First of all, I don’t think the Scrum itself is stupid and life draining, it’s the 1000 other things like managers emphasizing and prioritizing writing Jira tickets and doing time estimates while you’re trying to deliver that bug fix on the Friday afternoon. This is not it. Here, you’re your own manager, and Scrum is just a way of keeping track of things. Besides there are numerous benefits, but the most important ones to me:
- I want to keep track of my projects,
- I want to keep myself accountable, and actually finish my projects.
There are some additional benefits that are not obvious at first. Thinking about how to decompose your project into achievable tasks forces you to ACTUALLY think hard about what you’re trying to do, it forces you to do a deep analysis. Once you break it down, you’ll have clear steps on how you’re going to achieve something, and you’ll also have some insight when and how you’re going to complete your project.
Of course, I don’t think this is feasible for every little thing I do. I quickly found out it’s better to start immediately working on my idea, create something concrete, gather more information and to get a feeling is this something I’d really like to do or this was some passing whim. After I’m sure I find it fun (or useful), I’ll do some “project planning”.
Setting SMART goals
Couple of months ago my girlfriend (who is very smart) taught me about setting SMART goals. I keep forgetting what the acronym stands for, but I vividly remember when she first told me about it, it resonated with me. Well, instead of asking her for the 100th time what each letter means, I’ll now write it down:
- S - Specific: Clearly define what you want to achieve, including details like who, what, where and why. (e.g., “I’ll build a RISC-V core”, becomes “I’ll build a basic, single cycle, 32-bit RISC-V core supporting IMAC instruction set to improve my digital design skills, and to become familiar with the RISC-V ecosystem”.
- M - Measurable: Include criteria to track progress and know when you’ve succeeded, using numbers, percentages, or other data points.
- A - Achievable: Ensure the goal is challenging but realistic, with resources and capabilities to reach it.
- R - Relevant: Confirm the goal matters to your broader objectives and is worthwhile.
- T - Time-bound: Set a specific deadline or time frame for completion, creating urgency and focus.
Task breakdown
The next thing I decided on is the Project and Task breakdown. I decided on the following:
- I want to have the following hierarchy: Projects->Epics->Stories->Tasks.
- Each project can have multiple Epics. Each Epic describes a significant feature that I need to develop or some area that I need to study that would take multiple months.
- Epics are further decomposed into Stories. Each Story contains a meaningful unit of work that can be done in a month or so.
- Stories are decomposed into tasks. Each task would represent a concrete action needed to complete a Story.
Here is one hypothetical project example that for the hierarchy I’ve described above. Let’s say I want to design a floating-point unit. This would be my Project. Now, there are multiple ways how I would decompose this Project into Epics, but let’s say my approach is the following:
- Floating point unit documentation,
- Floating point unit design,
- Floating point unit validation on a Field Programmable Gate Array (FPGA).
- etc.
The 2nd Epic - Floating point unit design - I would further decompose into the following Stories:
- Multiplication (F.MUL),
- Leading Zero Counter (LZC),
- Division (F.DIV),
- Square root (F.SQRT),
- etc.
The F.MUL story can be decomposed into the following tasks:
- Implement mantissa multiplication,
- Implement normalization,
- Implement exponent calculation,
- Implement rounding,
- Create a Formal verification environment,
- Get a Formal proof of the F.MUL datapath,
- etc.
And here is a visualization of the above:
flowchart LR

A(Floating point unit)
A --> E1(Epic: FPU documentation)
A --> E2(Epic: FPU design)
A --> E3(Epic: FPU implementation on an FPGA)

subgraph FPU documentation
E1 --> E1S1(...)
end

subgraph FPU implementation on an FPGA
E3 --> E3S1(...)
end

subgraph "FPU Design"
E2 --> E2S1(Story: Multiplication F.MUL)
E2 --> E2S2(Story: Leading Zero Counter LZC)
E2 --> E2S3(Story: Division F.DIV)
E2 --> E2S4(Story: Square root F.SQRT)
E2S2 --> E2S2T1(...)
E2S3 --> E2S3T1(...)
E2S4 --> E2S4T1(...)
subgraph F.MUL
E2S1 --> E2S1T1(Task: Implement mantissa multiplication)
E2S1 --> E2S1T2(Task: Implement normalization)
E2S1 --> E2S1T3(Task: Implement exponent calculation)
E2S1 --> E2S1T4(Task: Implement rounding)
E2S1 --> E2S1T5(Task: Create Formal verification environment)
E2S1 --> E2S1T6(Task: Get a Formal proof of the F.MUL datapath)
end
end
Choosing tool for project and task planning
When it came time to pick tool for project management I wanted a tool that supported the following criteria:
- It must be free to use,
- It must be a web based tool because I’m working on multiple machines and multiple operating systems,
- It should have an establishaed reputation, i.e., there should be an existing user base, I don’t want the tool to be cancelled or disappear overnight,
- It should support building a hierarchy of Projects->Epics->Stories->Tasks as I’ve outlined previously,
- It should allow me to keep track of time for each Task,
- It should be possible to have a board (Kanban style) where I could see the task breakdown for the current month (Sprint),
- Once I set it it up, it should be easy to use - I should be able to plan tasks for the current month with a couple of clicks, adding Tasks, Stories, Epics and Projects should be simple.
There are bajillion tools that fit these criteria; I’ve spent a couple of days trying some of those. There are two tools that I really liked: JetBrains YouTrack and Notion. In the end I chose Notion, not because one tool is better than the other, it was simply a coin toss choice, and Notion won.
Retrospective: Using Notion
In retrospective, Notion was actually not that easy to set-up. It took me roughly 3 days to set up everything. In these 3 days I’ve included research, watching tutorials and all the trial and error before I got what I actually wanted. It might be a skill issue, but I think the main reason for the non-ease-of-use is it has a very rich featurset. It takes some time to get familiar with the required features, tool flow and the intended way or work.
I’ll mention two resources that actually got me started:
- Anthropic’s Claude AI - It helped a lot when I started using Notion. Btw I’m not endorsing Claude above any other currently available LLMs, I used it because I had the full subscription at the time.
- The Notion Tutorial - Full Course for Beginners on YouTube. This video helped ALOT. It’s long (roughly 2 hours) but it’s worth watching if you’re serious about using Notion. The video author also has lots of other videos on topics surrounding Notion and productivity in general. Fully recommend.
Using Notion to set things in motion
First I’ll start with the results, and then I’ll provide a step-by-step solution on how to implement this yourself in Notion.
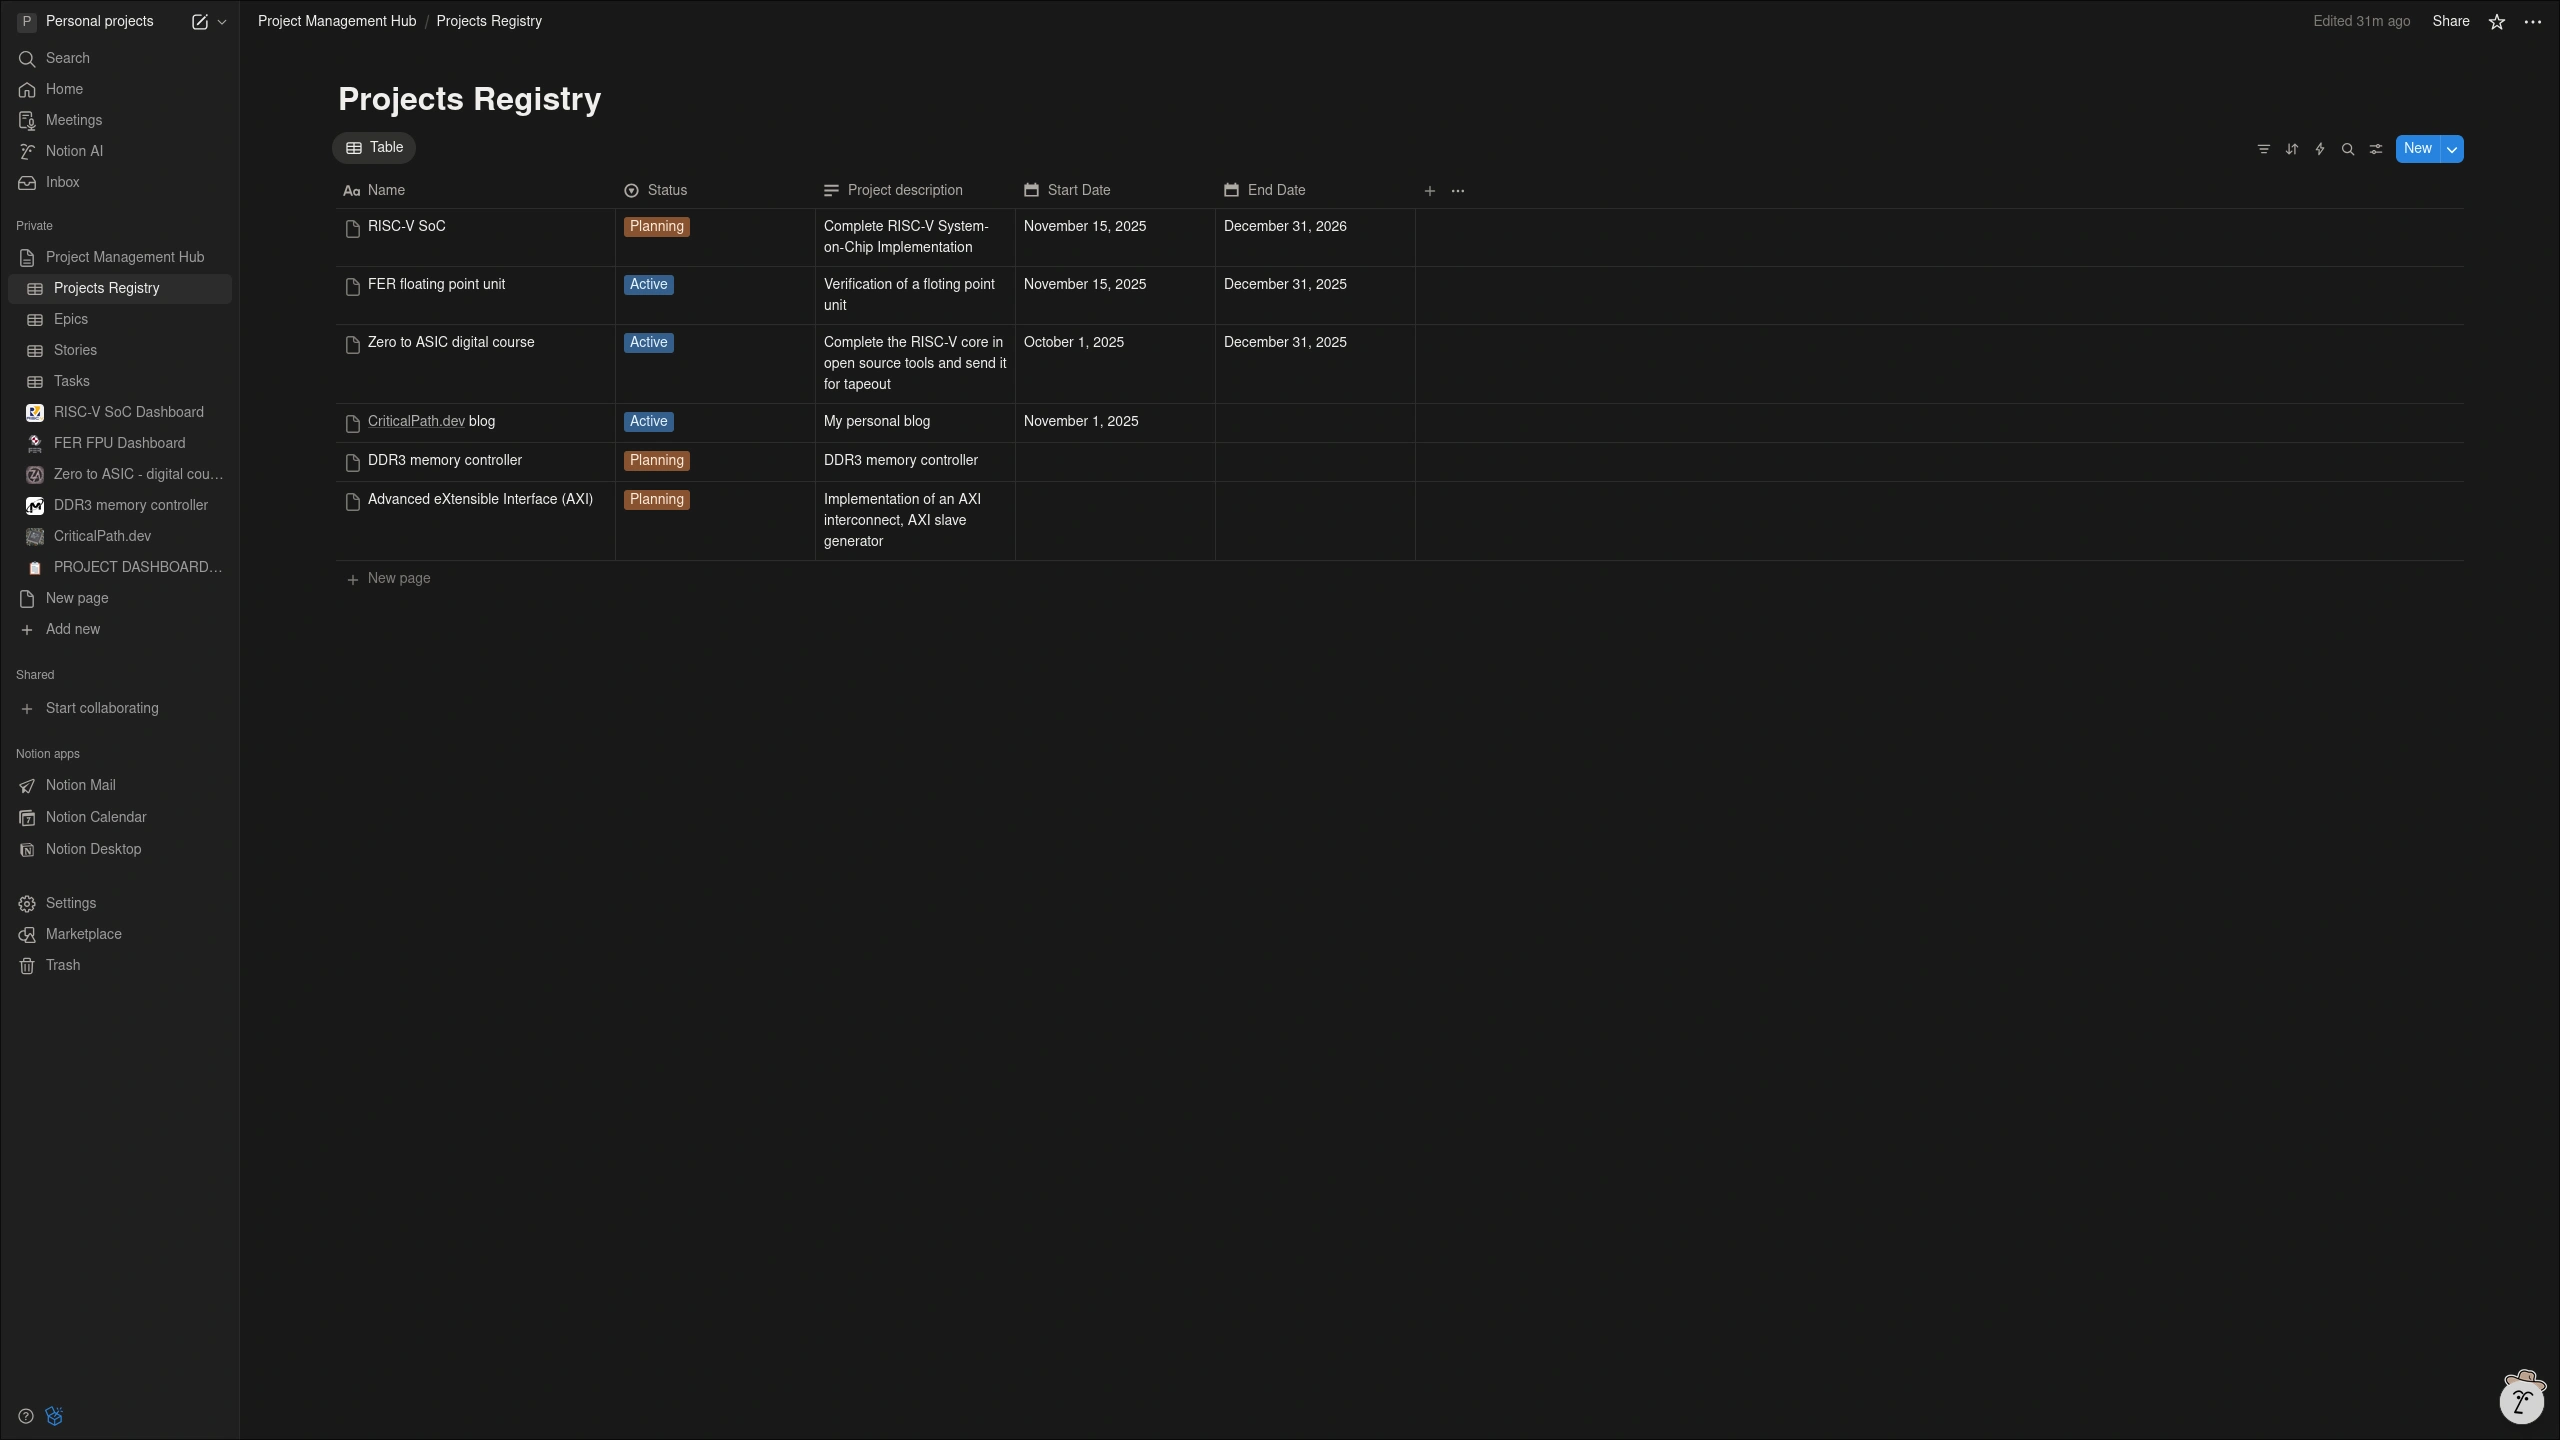
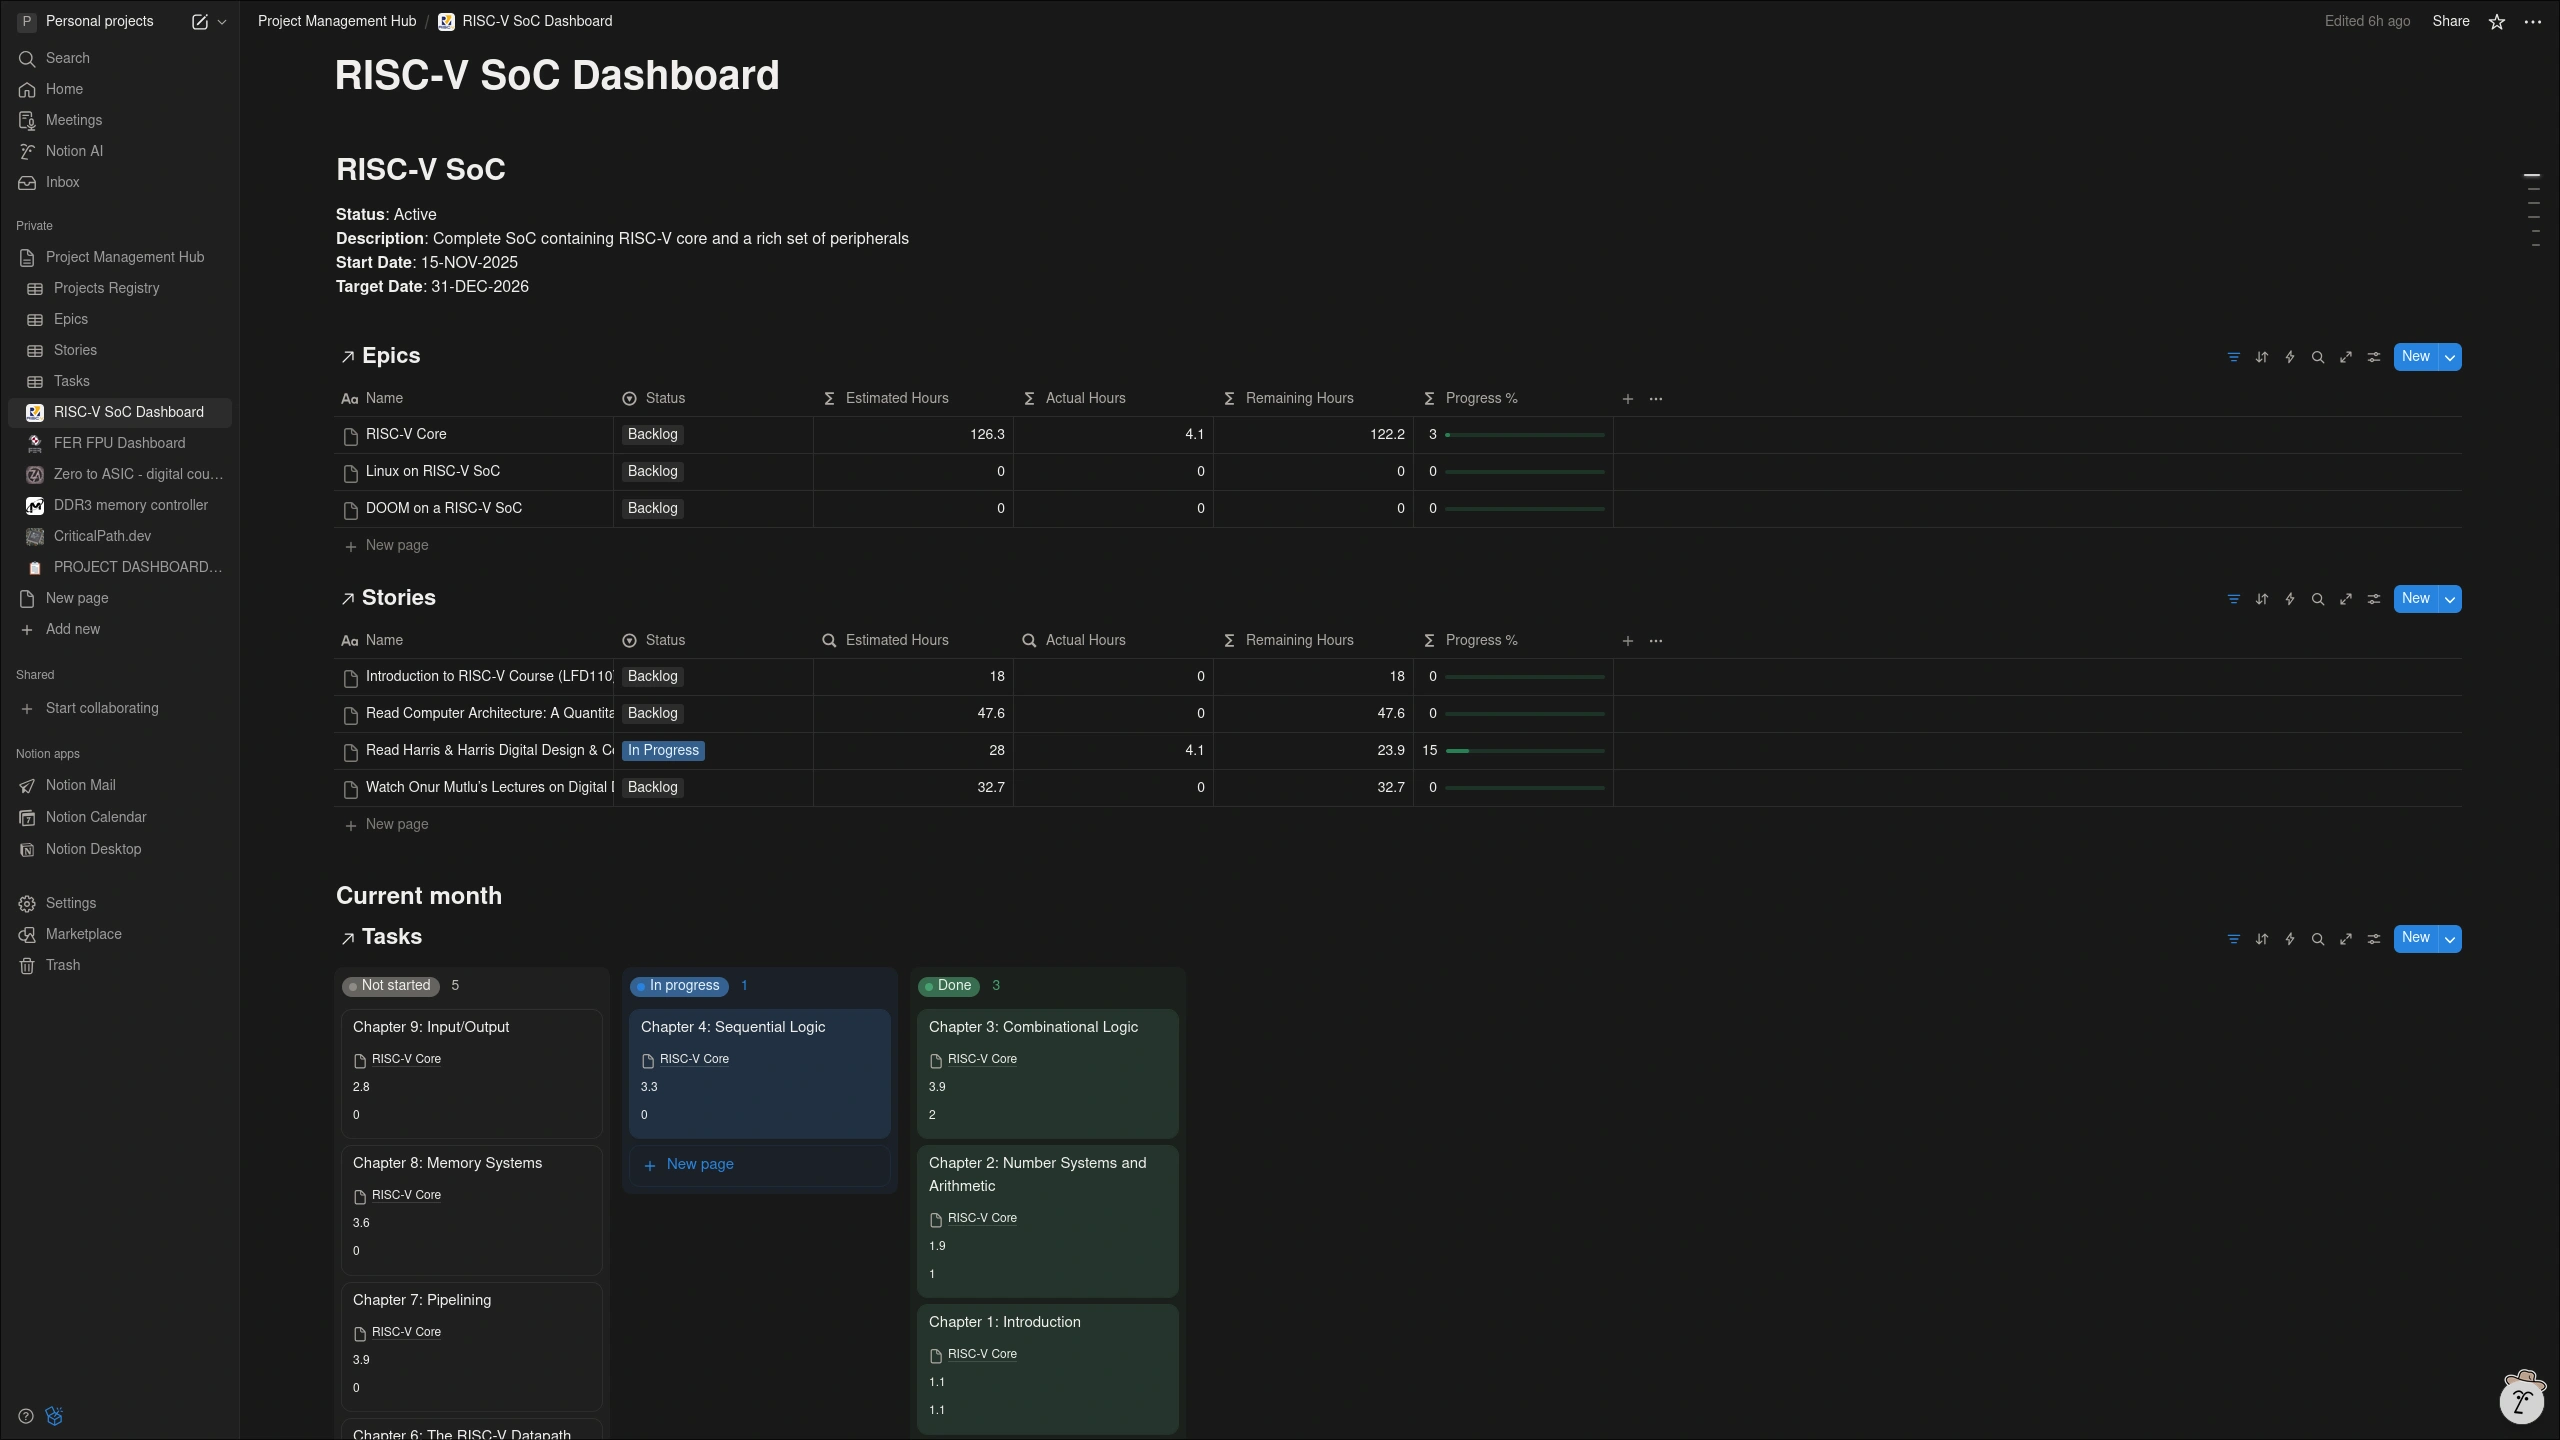
The solution I’ve built focuses around four main databases: one database containing Projects, one database containing Epics, one database containing all Stories and one database containing all Tasks. Each project gets its own separate page.
The Projects database lists all the projects with their status, description, start and end date.
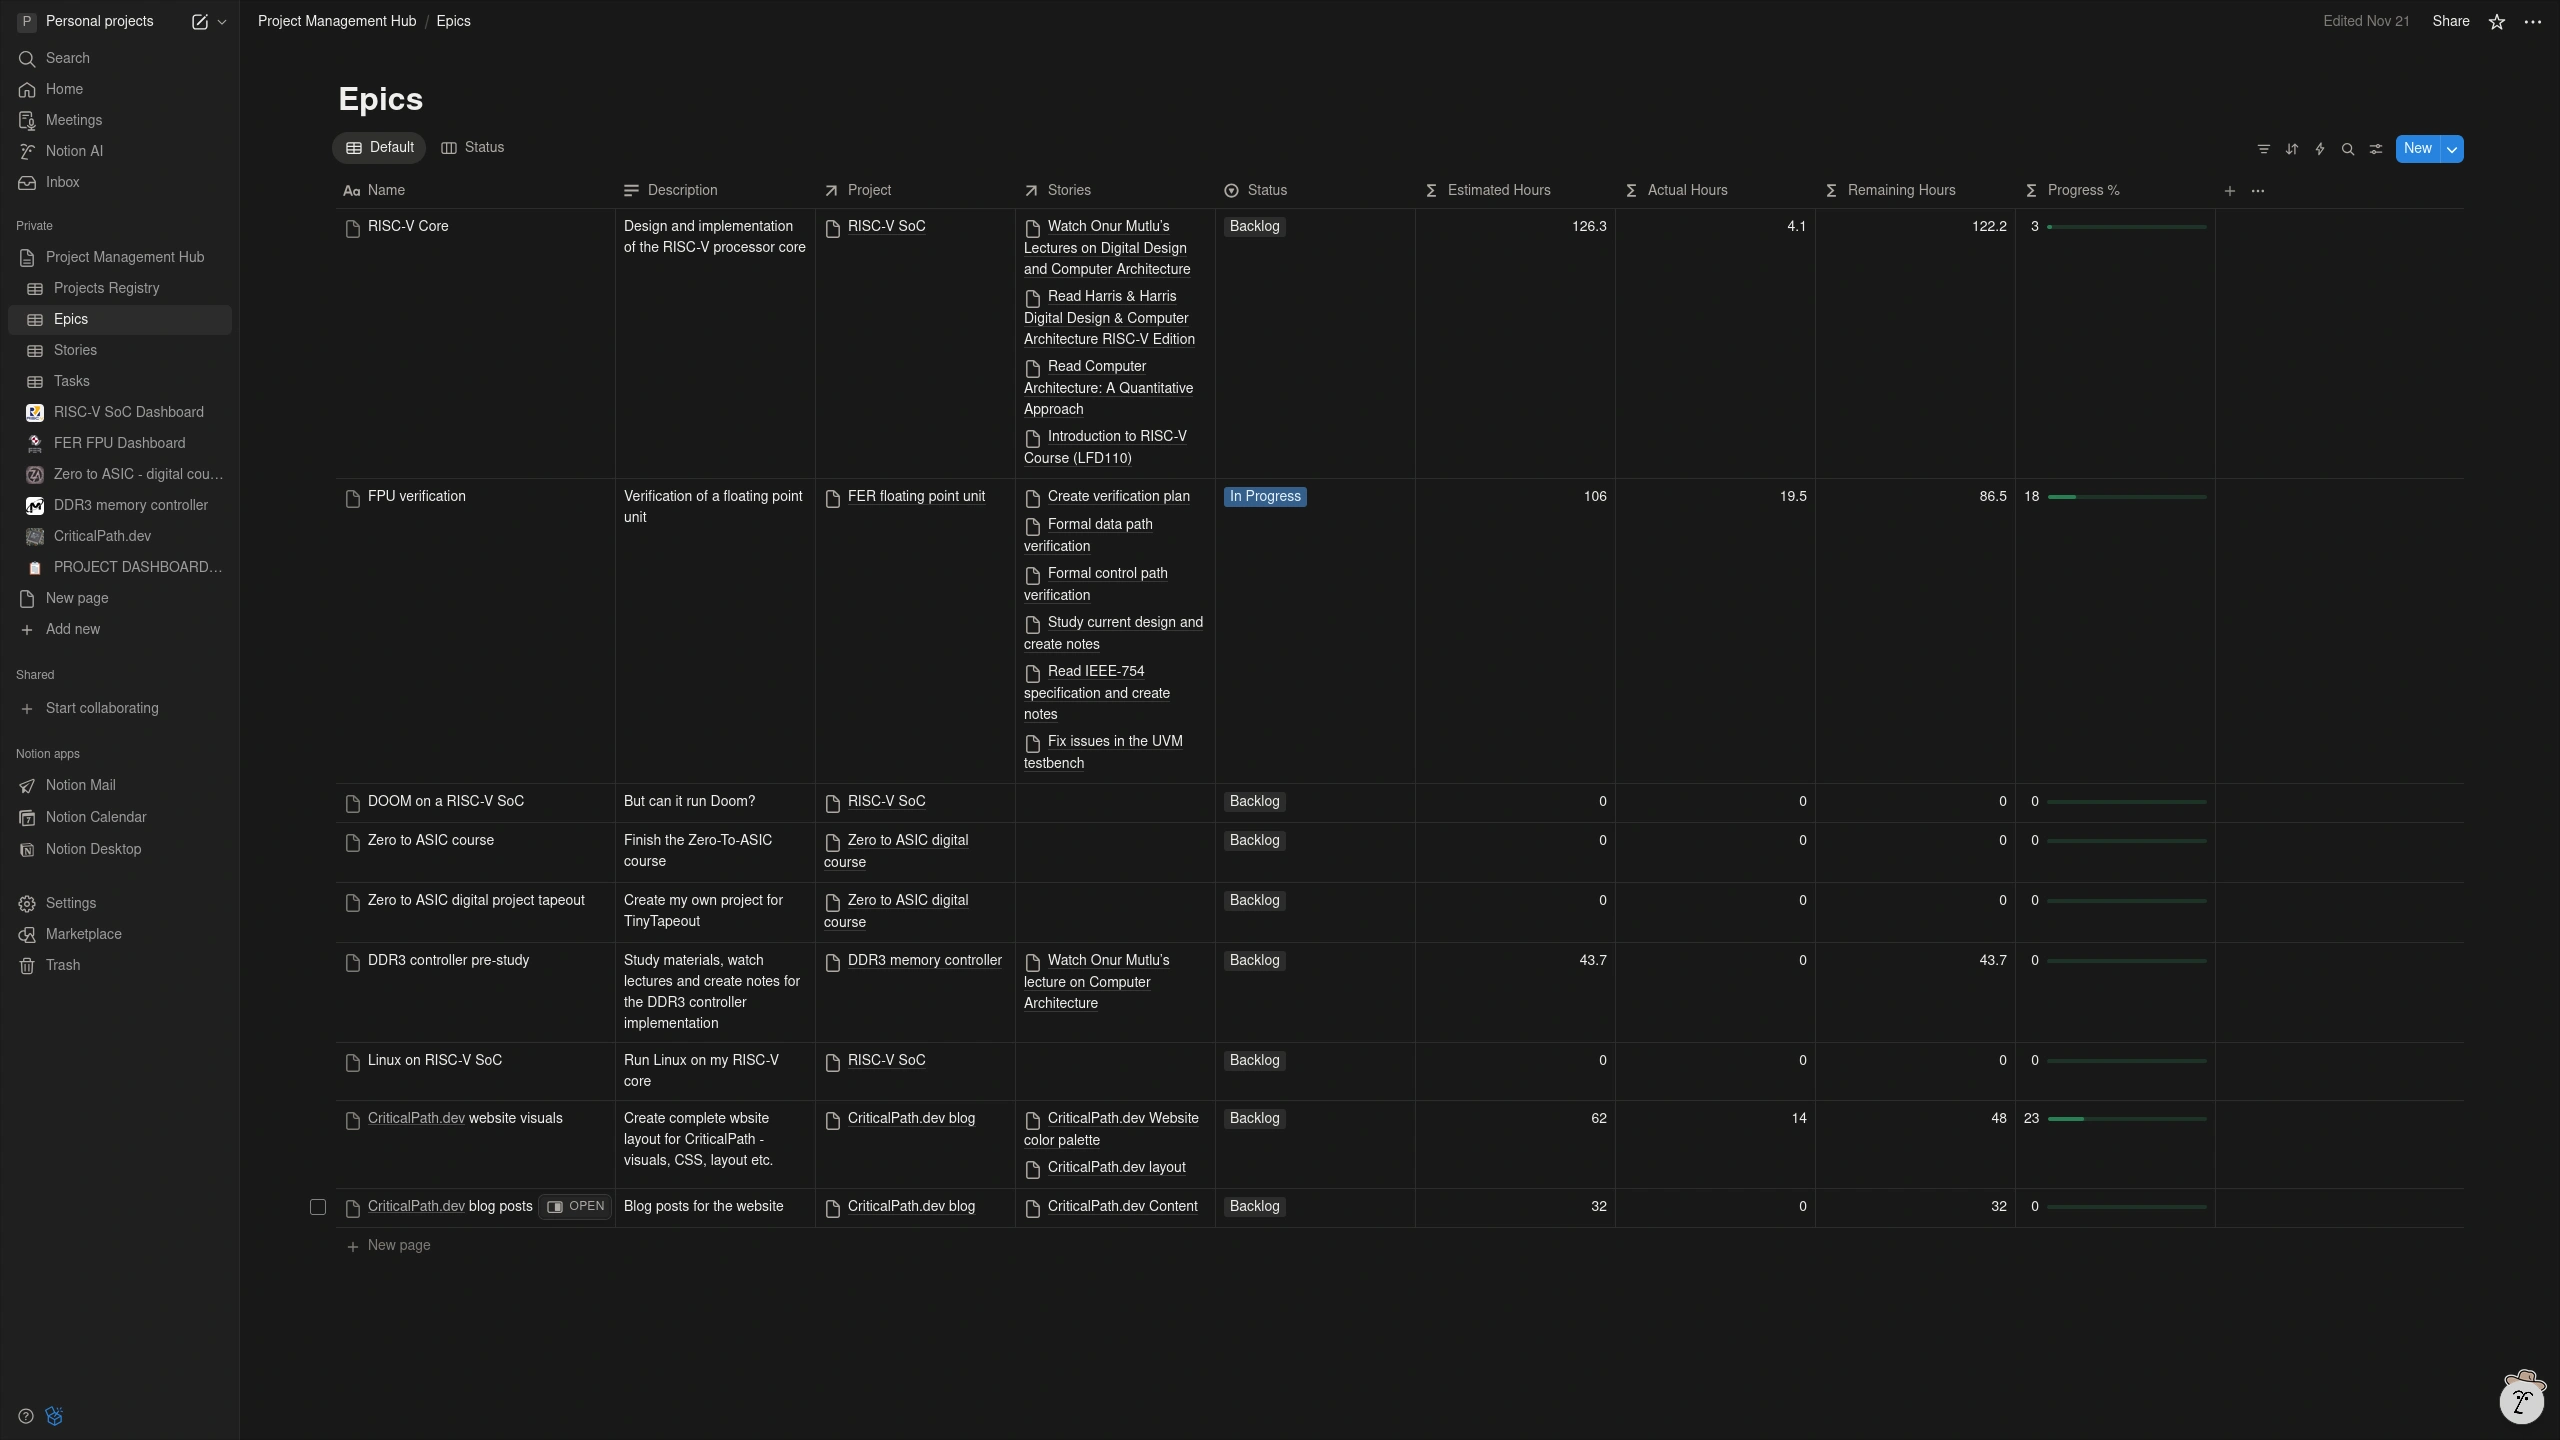
The Epics database contains all Epics for all Projects. Each Epic is assigned to on or more Projects. Each Epic contains a list of Stories required to finish that particular Epic. The Estimated Hours, Actual Hours, Remaining Hours, and Progress are automatically calculated. Estimated and Actual Hours are sum of the same-named properties of all Stories contained inside an Epic.
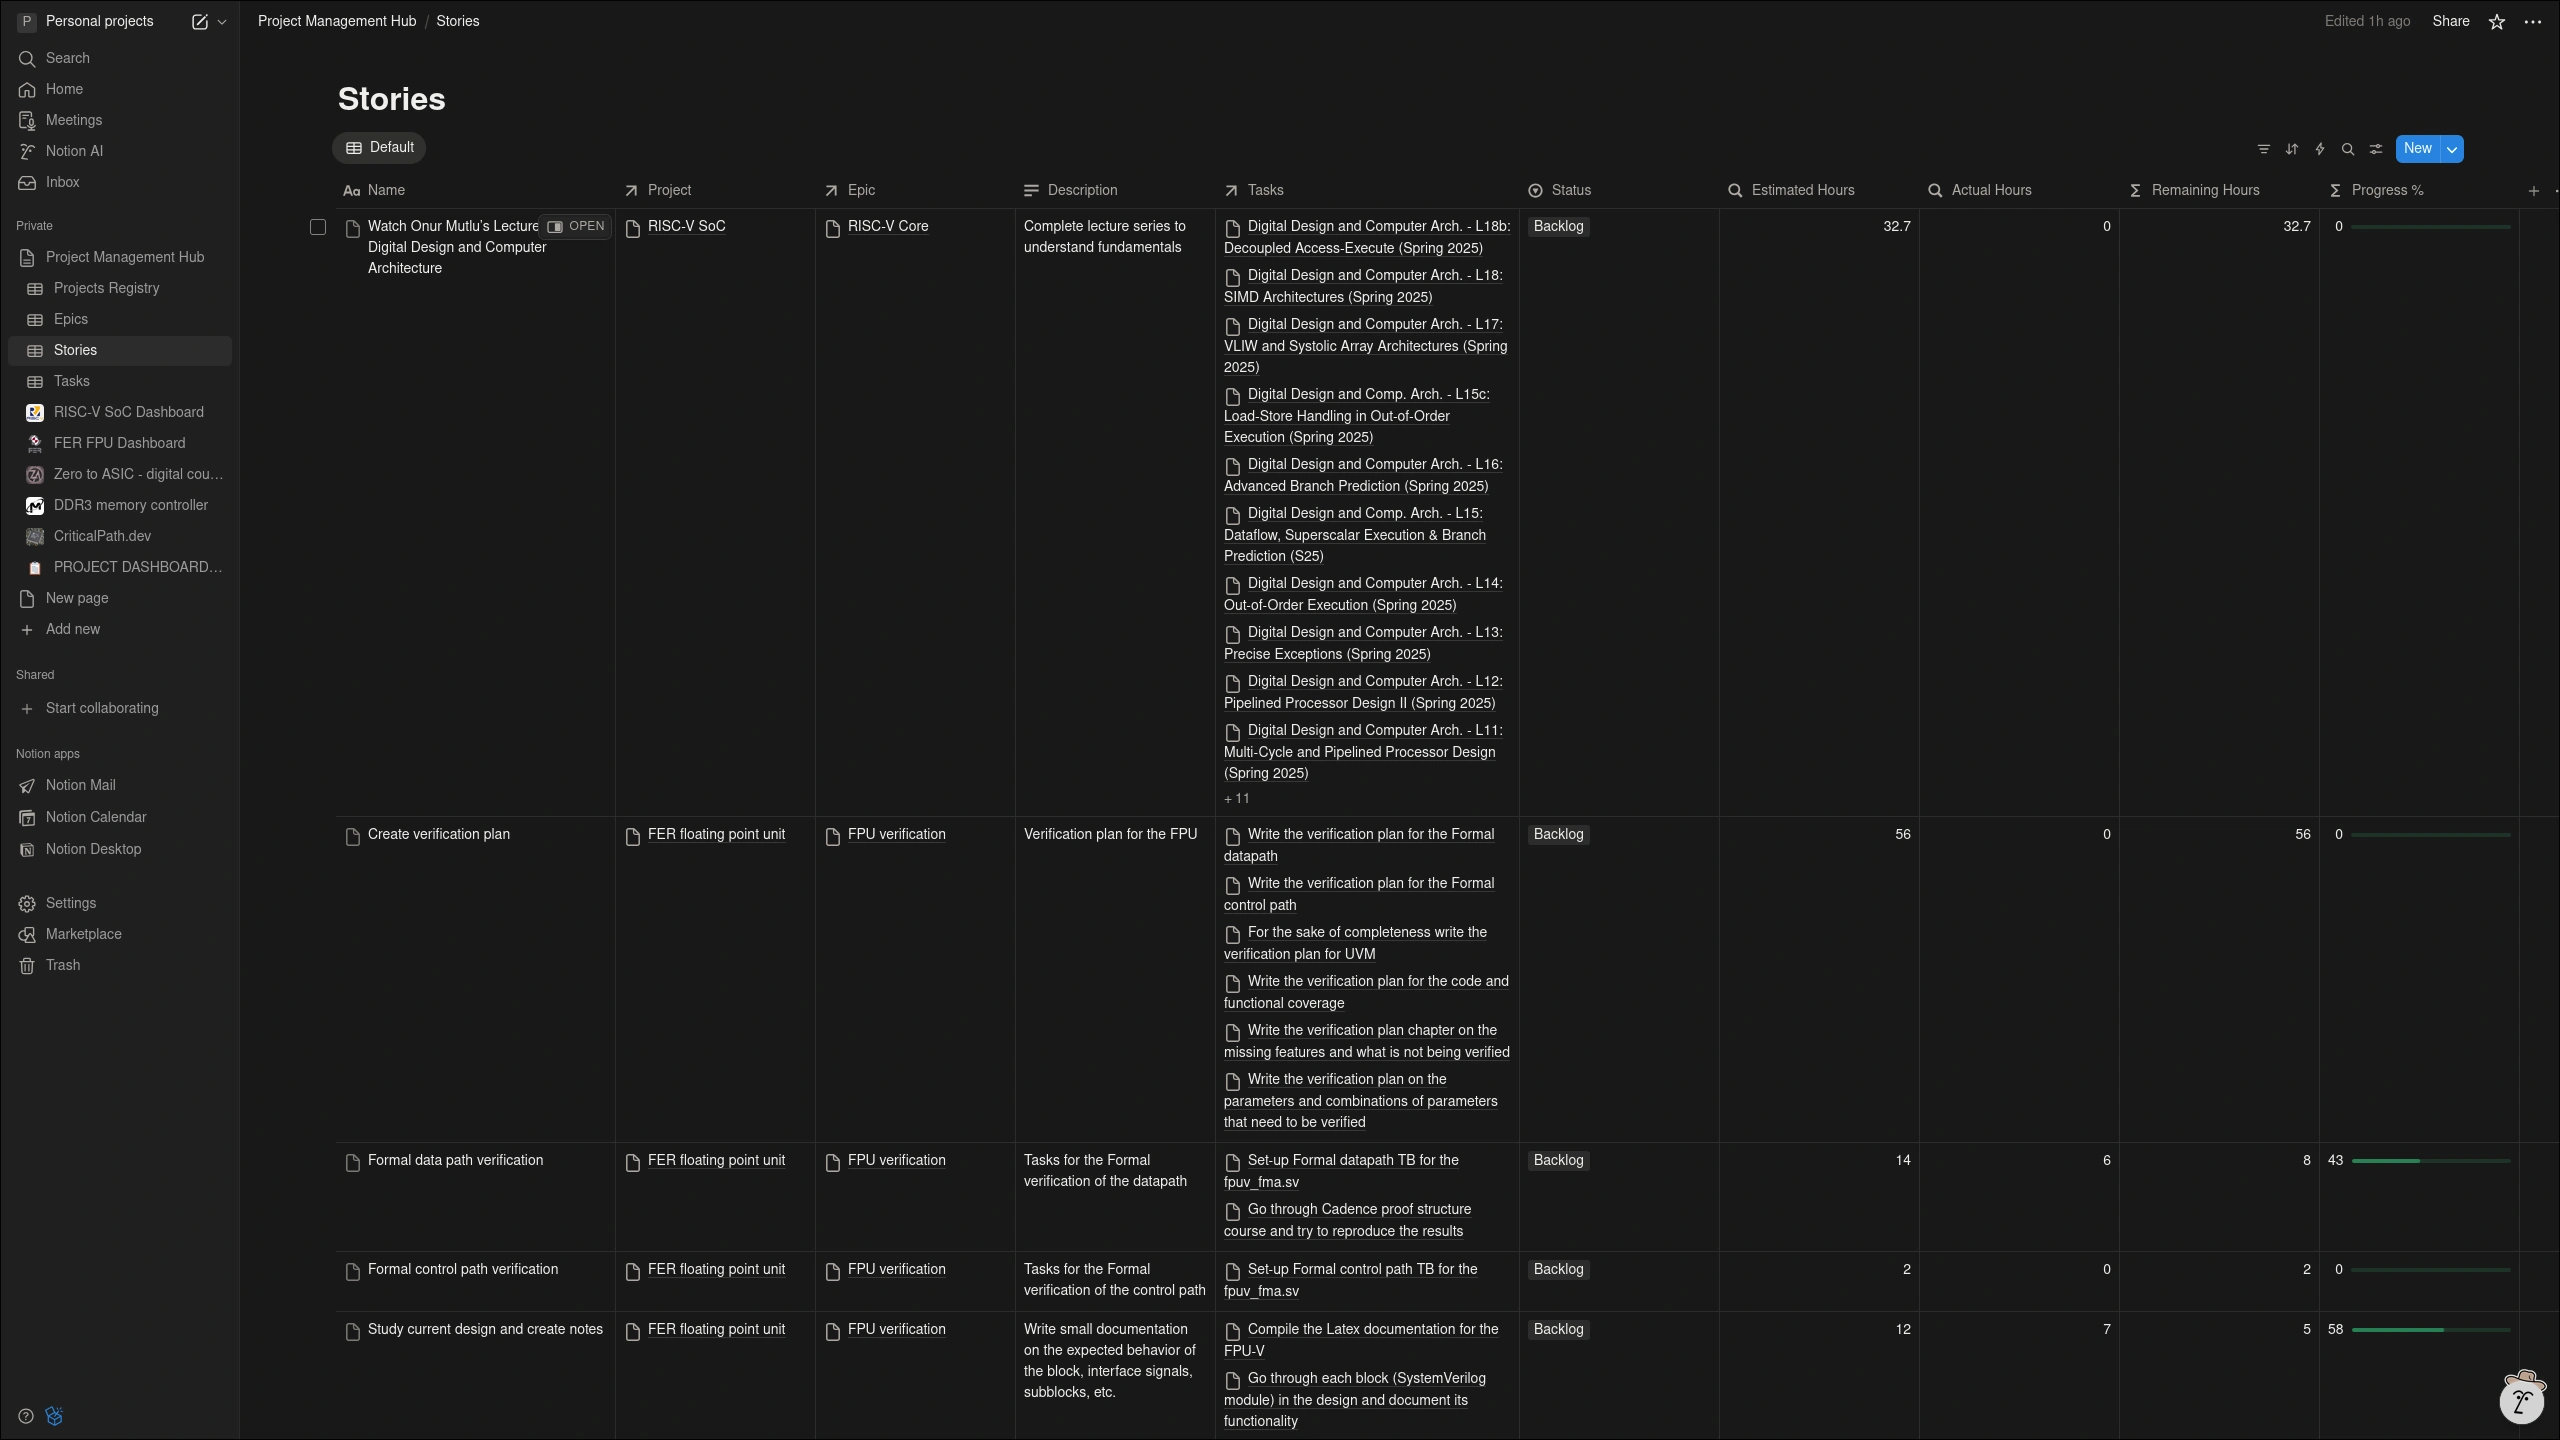
The Stories database contains all Stories for all Projects. Each Story is assigned to one (or more) Epics. Estimated Hours, Actual Hours, Remaining Hours and Progress are automatically calculated. Like in the Epics database, the Estimated Hours and the Actual Hours are are calculated by summing the values of the same-names properties for all Tasks contained within a Story.
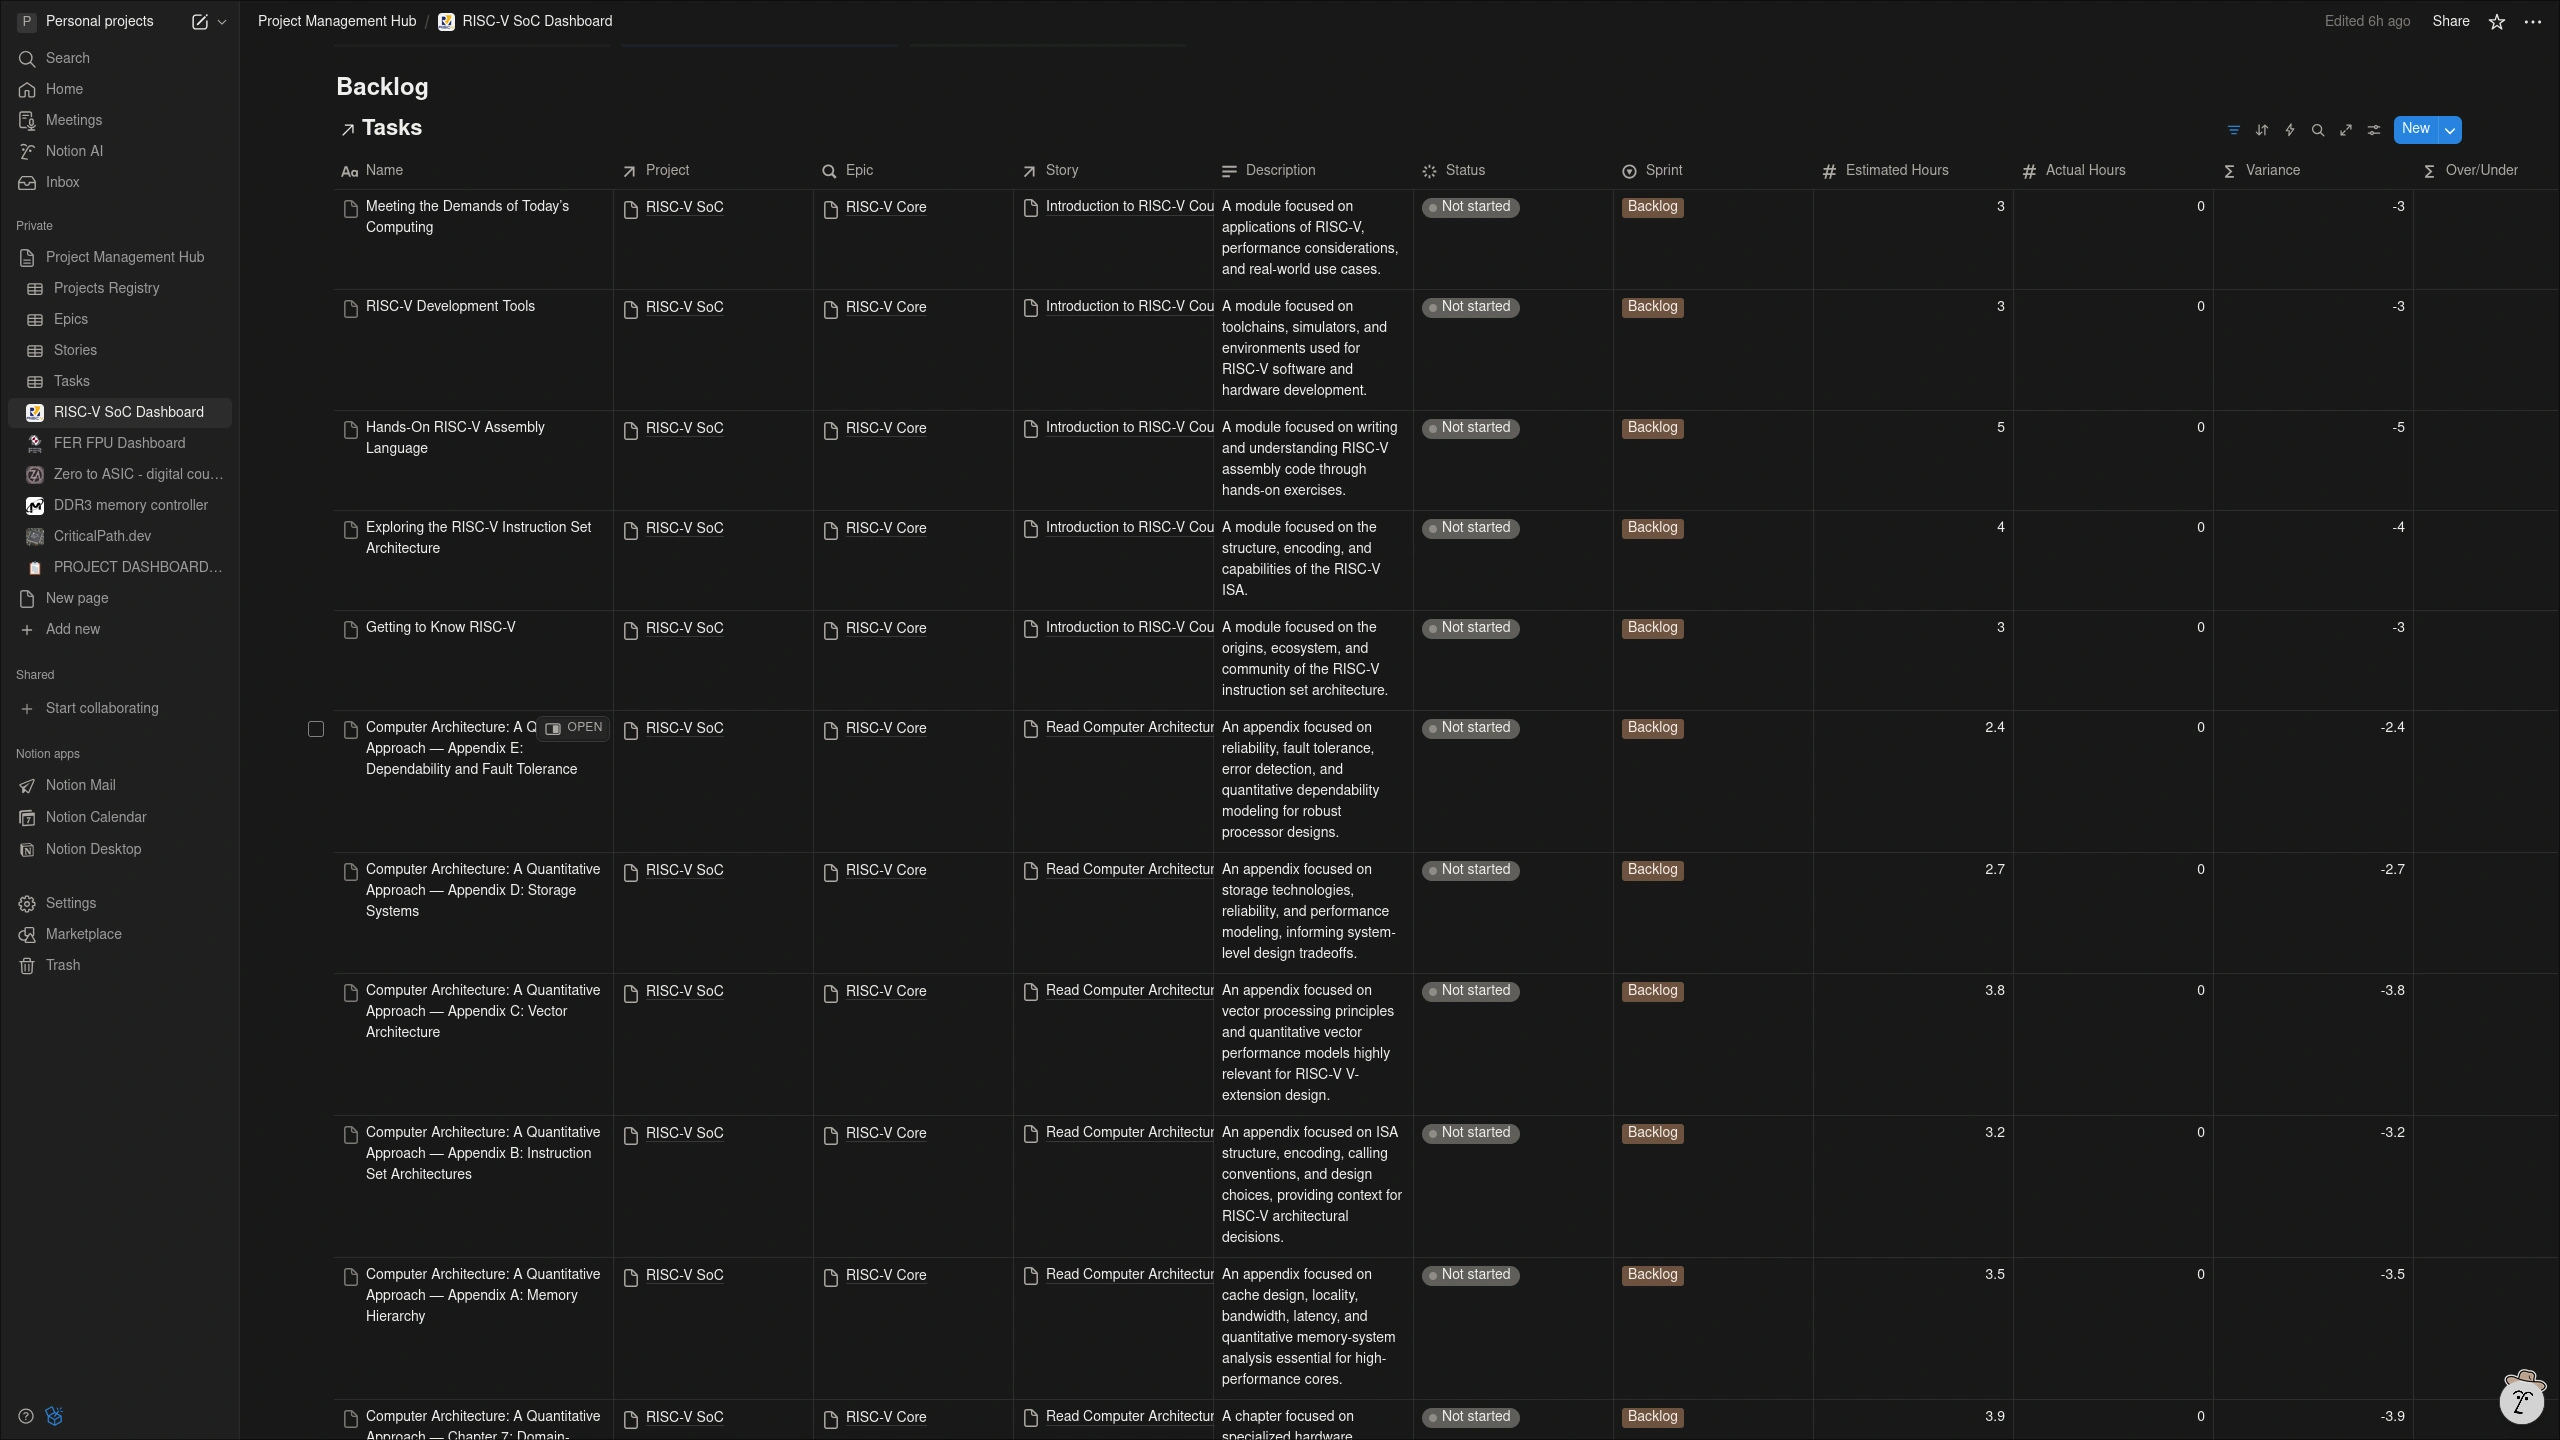
The Tasks database contains as list of Tasks for all Projects. Each Task is described with the following properties:
- Name of the task,
- Task description,
- Status (In progress, Ongoing, Done),
- Estimated hours - time it takes to finish a task,
- Actual Hours - time it took to finish a task,
- Over-Under - automatically calculated property, describing if the task was over or under estimated,
- Variance - time difference between the Estimated and Actual Hours. Also auto calculated.
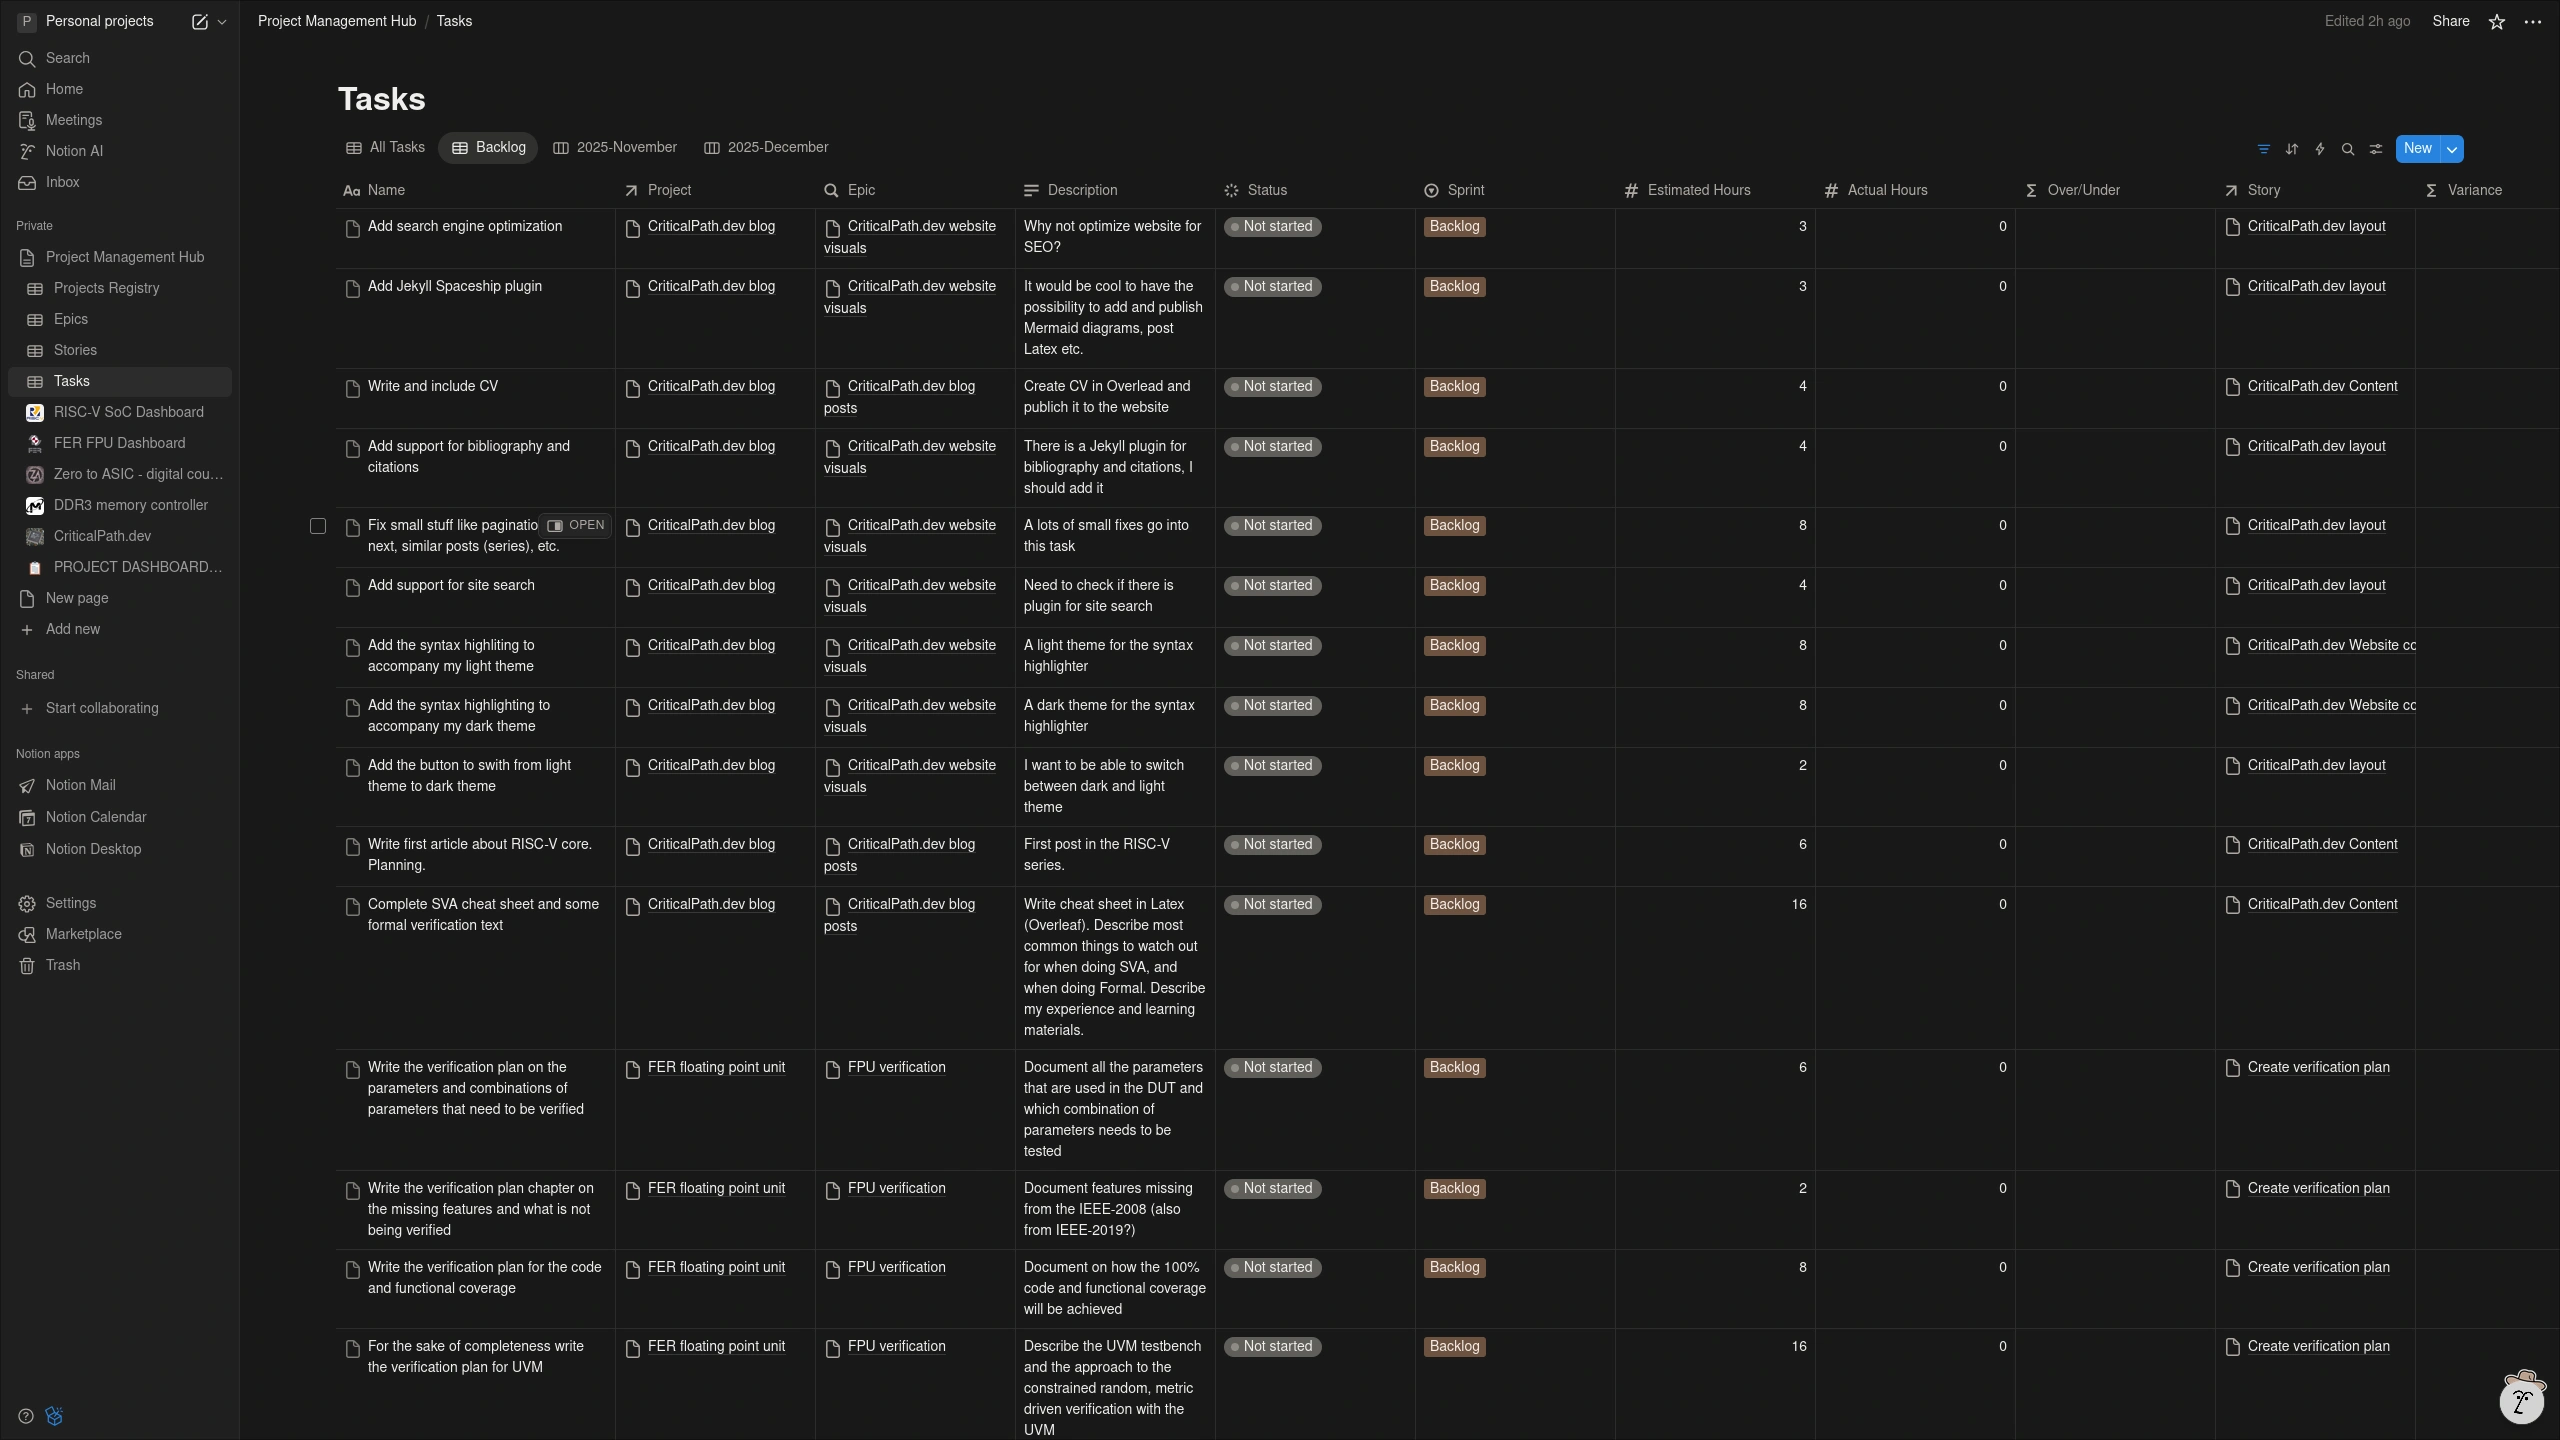
Tasks that are going to be worked on in the current month are displayed on a board. The Kanban board style is, in my opinion, a great tool to visually depict work at various stages of a process.
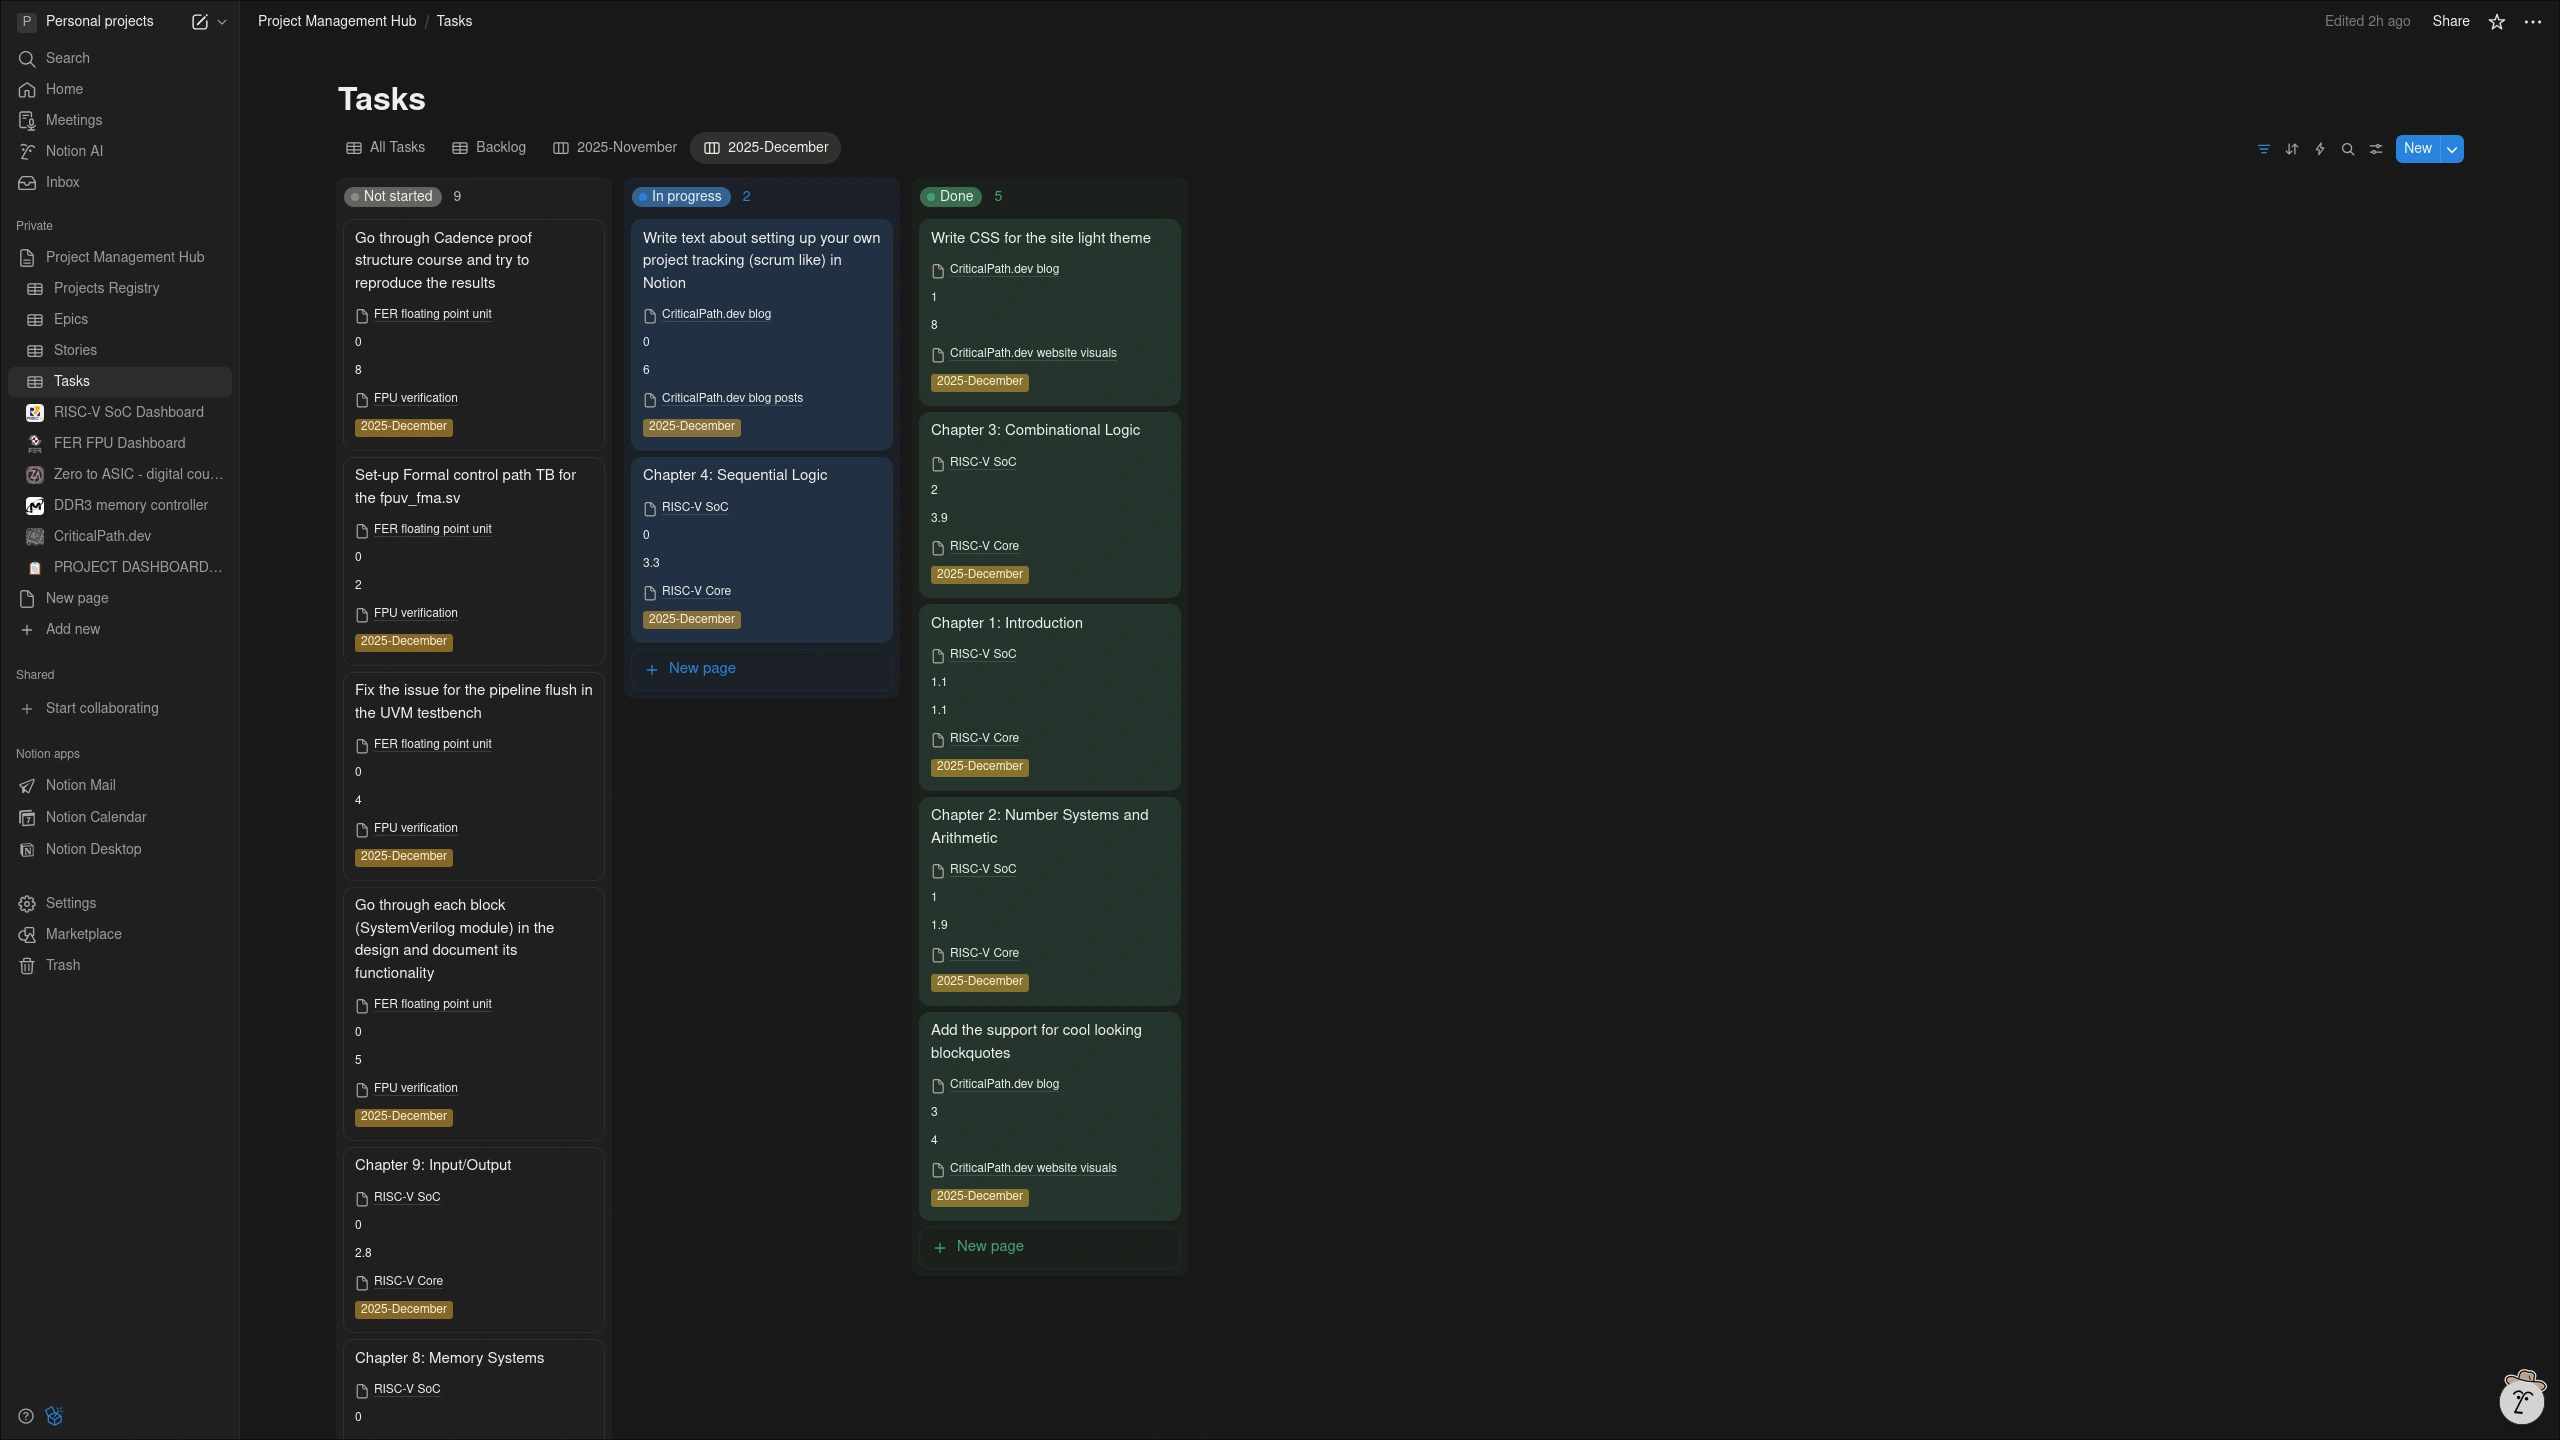
As I’ve mentioned before, each project gets a dedicated Project dashboard page. This page essentially contains a link to the Epics, Stories and Tasks databases, but it’s set up in such a way to provide a clear overview of the Project.
Tasks in the Project dashboard are displayed in two different views: Kanban style, and as a list of Project related tasks currently in the backlog.
Steps to set up a Scrum-based project management system in Notion
I’ve split the setup into the following steps:
- Core database setup,
- Create essential views,
- Create project dashboard template,
- Creating a project,
- Sprint (month) planning and execution
After you create a Notion account, you’ll be met with a default workspace. My suggestion is to remove the ‘New page’, ‘Welcome to Notion!’ and ‘To Do List’. Add everything under the ‘Private’ section.
Part 1: Core Database Setup
Step 1: Create Projects Registry
- Create a new page in Notion called “Project Management Hub”
- Type
/databaseand select “Database - Full page” - Name it “Projects”
- Add properties:
- Name (Title) - Project name
- Status (Select) - Options: Planning, Active, On Hold, Completed
- Description (Text) - Project description
- Start Date (Date)
- Target End Date (Date)
Step 2: Create Epics Database
- On the Project Management Hub page, create another database
- Type
/databaseand select “Database - Full page” - Name it “Epics”
- Add properties:
- Name (Title) - Epic name
- Projects (Relation) - Link to Projects Registry - Enable Two-way relation (Epics will appear in Projects database, and we’ll be able to use properties from the Epics database in Projects database)
- Description (Text) - Epic description
- Status (Formula) - From Stories (configure after Stories created)
- Estimated Hours (Formula) - From Stories (configure after Stories database is created)
- Actual Hours (Formula) - From Stories (configure after Stories created)
Notion: Rollup of rollups
The Estimated Hours and Actual Hours should (in my opinion) be automatically calculated by summing up values of same-named properties from all the Stories associated with a particular Epic. Unfortunately, Notion doesn’t support Rollups of Rollups, but fortunately there is a workaround for this. We can use formulas to calculate Estimated Hours and Actual Hours. I got this solution from the following YouTube video: How to Create a Nested Rollup in Notion (rollup of a rollup) 2024 Tutorial with free template
Step 3: Create Stories Database
- Create another database on the Project Management Hub page
- Type
/databaseand select “Database - Full page” - Name it “Stories”
- Add properties:
- Name (Title) - Story name
- Projects (Relation) - Link to Projects database - Enable Two-way relation
- Epic (Relation) - Link to Epics database - Enable Two-way relation
- Description (Text) - Story description
- Status (Formula) - From Tasks (configure after Tasks database is created)
- Estimated Hours (Rollup) - Story time estimate (configure after Tasks created)
- Actual Hours (Rollup) - From Tasks (configure after Tasks created)
Step 4: Create Tasks Database
- Create another database on the Project Management Hub page
- Type
/databaseand select “Database - Full page” - Name it “Tasks”
- Add properties:
- Name (Title) - Task name
- Project (Relation) - Link to Projects database - Enable Two-way relation
- Story (Relation) - Link to Stories database - Enable Two-way relation
- Epic (Rollup) - From Story -> Epic. Configure: Relation: Story, Property: Epic, Show original
- Description (Text) - Task description
- Status (Status) - Options: Not started, In progress, Done
- Month (Select) - Options: Backlog, January 2026, February 2026, March 2026, etc. Add your own relevant months.
- Estimated Hours (Number) - Time estimate
- Actual Hours (Number) - Time logged
Step 5: Configure Rollup Properties
In Stories:
- Click Actual Hours -> Configure rollup
- Relation: Tasks, Property: Actual Hours, Calculate: Sum
- Click Estimated Hours -> Configure rollup
- Relation: Tasks, Property: Estimated Hours, Calculate: Sum
- Click Status -> Edit Property -> Edit Formula. Formula:
length(prop("Tasks").filter(current.prop("Month").lower() == "backlog")) == length(prop("Tasks").map(current.prop("Month"))) ? "Backlog".style("red", "red_background") : (length(prop("Tasks").filter(current.prop("Status").lower() == "done")) == length(prop("Tasks").map(current.prop("Status"))) ? "Completed".style("green", "green_background") : "In progress".style("blue", "blue_background"))This will set the property automatically:
- If all Tasks for the selected Story are in Backlog -> Status = Backlog
- If all Tasks for the selected property are Done -> Status = Done
- Otherwise -> Status = In progress
In Epics:
- Click Estimated Hours -> Edit Property -> Edit Formula
- Formula:
sum(prop("Stories").map(current.prop("Estimated Hours"))) - Click Actual Hours -> Edit Property -> Edit Formula
sum(prop("Stories").map(current.prop("Actual Hours"))) - Click Status -> Edit Property -> Edit Formula. Formula:
length(prop("Stories").filter(current.prop("Status").lower() == "backlog")) == length(prop("Stories").map(current.prop("Status"))) ? "Backlog".style("red", "red_background") : (length(prop("Stories").filter(current.prop("Status").lower() == "completed")) == length(prop("Stories").map(current.prop("Status"))) ? "Completed".style("green", "green_background") : "In progress".style("blue", "blue_background"))This will set the property automatically:
- If all Stories for the selected Epic are in Backlog -> Status = Backlog
- If all Stories for the selected property are Completed -> Status = Completed
- Otherwise -> Status = In progress
Step 6: Add Calculated Properties
In Epics, add:
-
Remaining Hours (Formula):
prop("Estimated Hours") - prop("Actual Hours") -
Progress % (Formula):
round(prop("Actual Hours") / prop("Estimated Hours") * 100) - Click Progress % -> Edit property -> Show as: Bar
In Stories, add:
-
Remaining Hours (Formula):
prop("Estimated Hours") - prop("Actual Hours") -
Progress % (Formula):
round(prop("Actual Hours") / prop("Estimated Hours") * 100) - Click Progress % -> Edit property -> Show as: Bar
In Tasks, add:
-
Variance (Formula):
prop("Actual Hours") - prop("Estimated Hours") -
Over/Under (Formula):
if(prop("Actual Hours") > prop("Estimated Hours"), "Over".style("red", "background_red"), if(prop("Actual Hours") == 0, "", "✓ Under".style("green", "background_green")))
Part 2: Create Essential Views
Views for Epics
-
Full view (Table)
- Rename view to: Full view
- Group by: Projects
-
Default view (Table)
- Show: Name, Projects, Status, Estimated Hours, Actual Hours, Progress %
- Group by: Project
-
By Status (Board)
- Group by: Status
- Filter by Project as needed
Views for Stories
-
Full view (Table)
- Rename view to: Full view
- Group by Project
- Sort by: Epic
-
Default view (Table)
- Show: Name, Project, Epic, Status, Estimated Hours, Actual Hours, Progress %
- Group by: Project
- Sort by: Epic
-
By Epic (Table)
- Group by: Epic
- Show time tracking columns
Views for Tasks
-
Current Month (Board) - PRIMARY VIEW
- Group by: Status
- Filter: Month -> Is -> January 2026
- Filter: Status -> Is not -> Backlog
- Properties: Name, Project, Epic, Estimated Hours, Actual Hours
- Sort: Project
- This shows ALL current work across ALL projects!
-
All Backlogs (Table)
- Filter: Month -> Is -> Backlog
- Group by: Projects
- Sort by: Projects, Story
-
By Project (Table)
- Group by: Projects
- Sort by: Status, Projects
-
Time Tracking (Table)
- Show: Name, Projects, Epic, Story, Estimated Hours, Actual Hours, Variance, Over/Under
- Group by: Projects
Part 3: Create Project Dashboard Template
Step 1: Create Template Page
- In Project Management Hub, create a new page: “PROJECT DASHBOARD TEMPLATE”
- Add header:
# [Project Name]

⚠️ TEMPLATE - Duplicate for each new project

**Summary**: [Project summary]
Set 2: Add Linked Database - Projects
- Type
/linked database - Select “Projects”
- Create new view: Project Name
- Filter: Project -> Name -> [leave empty - will set per project]
Step 3: Add Linked Database - Epics
- Type
/linked database - Select “Epics”
- Create new view: “Project Epics”
- Filter: Project -> [leave empty - will set per project]
- Show: Name, Status, Estimated Hours, Actual Hours, Remaining Hours, Progress %
- Group by: Status
Step 4: Add Linked Database - Stories
- Type
/linked database - Select “Stories”
- Create new view: “Project Stories”
- Filter: Project -> [leave empty]
- Show: Name, Epic, Status, Estimated Hours, Actual Hours, Remaining Hours, Progress %
- Group by: Epic
Step 5: Add Linked Database - Current Sprint Tasks
- Type
/linked database - Select “Tasks”
- Create new view: “Project Current Month”
- View type: Board
- Filters:
- Project -> [leave empty]
- Month -> Is -> January 2026
- Group by: Status
- Show: Name, Epic, Estimated Hours, Actual Hours
Step 6: Add Linked Database - Backlog
- Type
/linked database - Select “Tasks”
- Create new view: “Project Backlog”
- View type: Table
- Filters:
- Project -> [leave empty]
- Month -> Is -> Backlog
- Sort by: Story
- Group by: Story
Template is complete!
Part 4: Create Your First Project
Let’s create first project to demo the template.
Step 1: Register the Project
- Go to Projects Registry database
- Click “New”
- Fill in:
- Name: RISC-V SoC
- Status: Active
- Description: Complete RISC-V System-on-Chip implementation
- Start Date: [Your date]
- Target End Date: [Your target date]
Step 2: Create Project Dashboard
- Go to PROJECT DASHBOARD TEMPLATE
- Click “…” menu → Duplicate
- Rename to “RISC-V SoC Dashboard”
- Update summary
- Update all linked database filters:
- In each view, edit filter: Project -> Is -> RISC-V SoC
Step 3: Create Epics
- Go to Epics database
- Create three entries:
Epic 1:
- Name: RISC-V Core
- Project: RISC-V SoC
- Description: Design and implementation of the RISC-V processor core
Epic 2:
- Name: AXI Interconnect
- Project: RISC-V SoC
- Description: Implementation of AXI bus interconnect for system communication
Epic 3:
- Name: AXI Slave Generator
- Project: RISC-V SoC
- Description: Tool for generating AXI slave peripherals
Step 4: Create Stories
- Go to Stories database
- Create two entries:
Story 1:
- Name: Watch Onur Mutlu’s Lectures on Digital Design and Computer Architecture
- Project: RISC-V SoC
- Epic: RISC-V Core
- Description: Complete lecture series to understand fundamentals
Story 2:
- Name: Read Harris & Harris: Digital Design & Computer Architecture RISC-V Edition
- Project: RISC-V SoC
- Epic: RISC-V Core
- Description: Study the textbook chapters on RISC-V architecture
Step 5: Create Tasks
- Go to Tasks database
- Create tasks for the Harris & Harris story:
Task 1:
- Name: Chapter 1 - From Zero to One
- Project: RISC-V SoC
- Story: Read Harris & Harris: Digital Design & Computer Architecture RISC-V Edition
- Description: Introduction to digital systems
- Status: Not started
- Month: Backlog
- Estimated Hours: 3
Task 2:
- Name: Chapter 2 - Combinational Logic Design
- Project: RISC-V SoC
- Story: Read Harris & Harris: Digital Design & Computer Architecture RISC-V Edition
- Status: Not started
- Month: Backlog
- Estimated Hours: 4
Task 3:
- Name: Chapter 3 - Sequential Logic Design
- Project: RISC-V SoC
- Story: Read Harris & Harris: Digital Design & Computer Architecture RISC-V Edition
- Status: Not started
- Month: Backlog
- Estimated Hours: 4
Continue creating tasks for remaining chapters…
Note: The Epic column auto-populates via rollup from Story → Epic.
Part 5: Sprint Planning and Execution
Planning Your First Sprint
- Go to Tasks database
- View “All Backlogs”
- Filter or sort by Project: RISC-V SoC
- Select tasks for January 2026 (aim for monthly capacity)
- For each selected task:
- Change Month: Backlog-> January 2026
- Change Status: Backlog -> To Do
Using the Unified Kanban
- Go to Tasks database
- View “Current Month”
- See all January 2026 tasks from all projects
- Drag tasks between columns:
- Not started → In progress (when starting)
- In progress → Done (when complete)
- Tasks are grouped by Status, sorted by Project
Daily Workflow
Morning:
- Open “Current Month” Kanban
- Review all active tasks across projects
- Move 1-3 tasks to “In progress”
During work:
- Focus on ongoing tasks
- Track time manually or with timer
End of day:
- Update Actual Hours on tasks worked
- Move completed tasks to “Done”
- Move unstarted tasks back to “Not started” if needed
Ending a Month (Sprint)
- Go to “Current Month”
- Select all tasks in “Not started” and “In progress”
- Bulk edit: Month -> February 2026
- Update Kanban filter: Month -> Is -> February 2026